I am a Physics PhD candidate. My main thesis is about analyzing astronomical data. Check out my comprehensive Data Science skillset from my portfolio below:
Data presentation skills
Visualization skills
-
link to accurate scientific visualization of telescope data
-
This website is written in
markdownand parsed to a working website withPython Pelican
Software engineering
performance profiling
- link1
to the different scaling plots from performance profiling (in
Python) for reading 51 GB of CSV files in parallel - link2
to the single threaded version code for reading the same 51 GB of CSV files with three approaches, 1)
Python Pandas, 2)RwithBashand 3) theRpackageFastCSVSample - link3 to a visualiation of the log file from the
Intel Vtuneprofiler tool. I was able to get rid of a performance bottleneck using the information of the visualization and speeding up the code by at least 10 times.
Statistical and Machine Learning skills
Clustering
- link to Gaussian mixture clustering for separating different populations of data (signal vs noise from foreground and background)
Regression - optimization
- link to a custom-built
Gaussian processfor to encapsulate the properties of the problem setting. The code was written withPython, C++andCython. The parallelization was achieved withOpenMPandIntel Math Kernel Library.Gaussian Processis a powerful, flexible statistical algorithm. An important use case ofGaussian Processis for tuning the hyperparameters of Machine Learning algorithms such as neural networks (link to a related NIPS publication).
Model comparison / hypothesis testing
- link to model comparison by computing the Bayes factor
- link to determining model complexity of a Gaussian Mixture Model
Data query (SQL) / wrangling / scraping
- link to an add-on to a Supercomputer Package (Spack) for querying the
https://pypi.python.org/pypiPython package indices and parsing the installation recipes for Python packages - link to a Python script that queries a
MySQLdatabase and returns aPandas dataframe
PhD project 1 Link to GitHub repository
understanding the dynamics of a merging galaxy cluster
Accurate scientific visualization 1
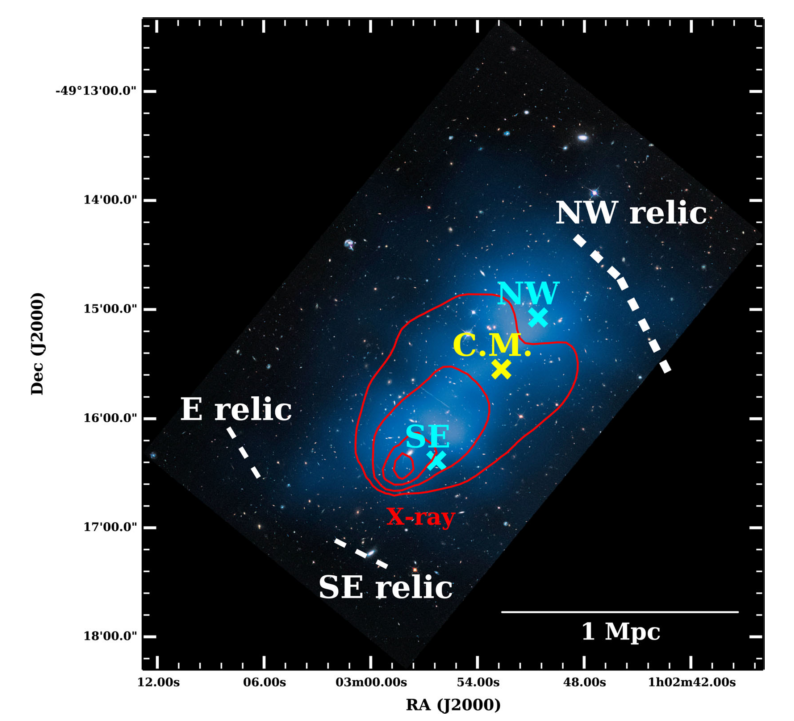
Fig.1 Accurate scientific visualization of the galaxy cluster El Gordo by
overlaying inferred information on Hubble Space Telescope data.
The two components of Dark Matter are marked by the blue crosses (northwest (NW) and southeast
(SE) ). I have also added contours of the gas component from the
X-ray data in red. The white dashed lines indicate the locations where
shockwaves (relics) were detected in the radio wavelengths. All these
observables help confirm that the components of the galaxy cluster went through
a merger.
By making use of the merger shockwave observation in the radio
wavelengths, we show that two main dark matter components of this
particular galaxy cluster are likely to be moving towards one another for a
second merger (the returning scenario is more likely than the outgoing scenario).
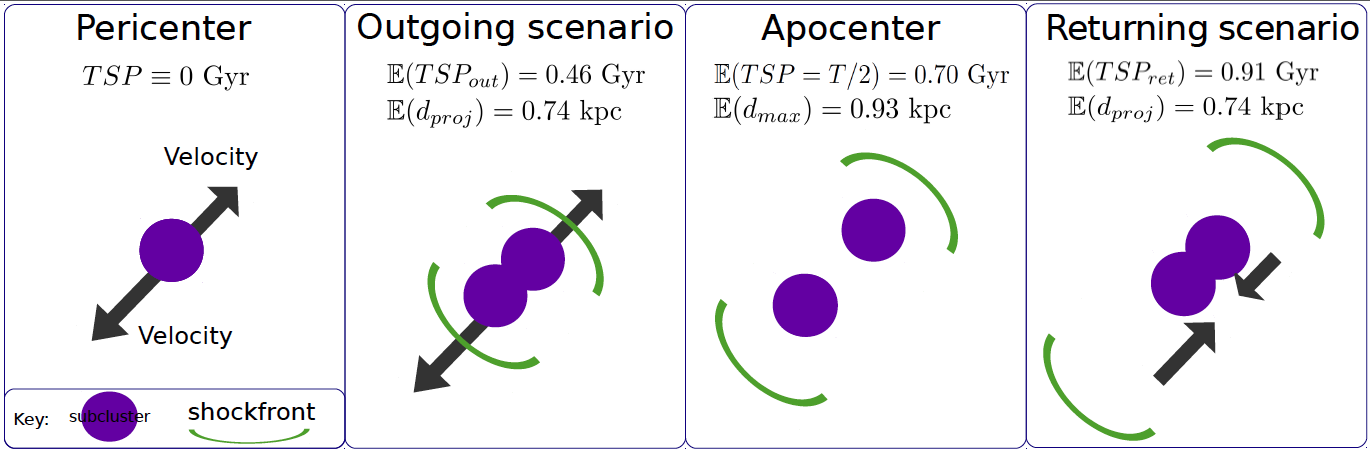
Fig. 2 of my paper - Illustration of the spatial location of different
components of the merger cluster El Gordo at different stages of the
merger.
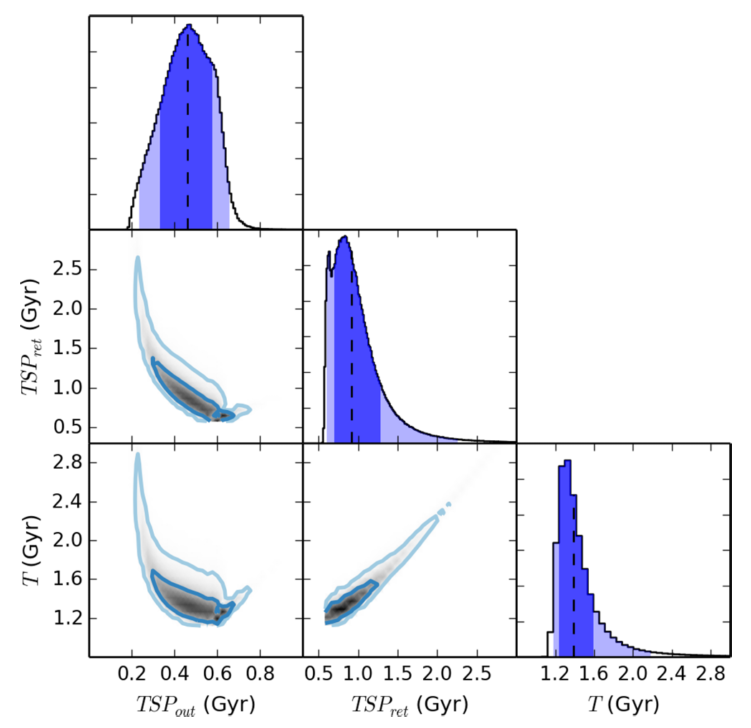
Fig. 3 the marginal distribution of the estimated time-since-pericenter (TSP)
for the two merger scenarios (ret for returning and out for outgoing) and
the periodicity T. The shaded region are the 68% and the 95% confidence
intervals for the 1D marginal distribution on the diagonal subplots in the
triangular plots.
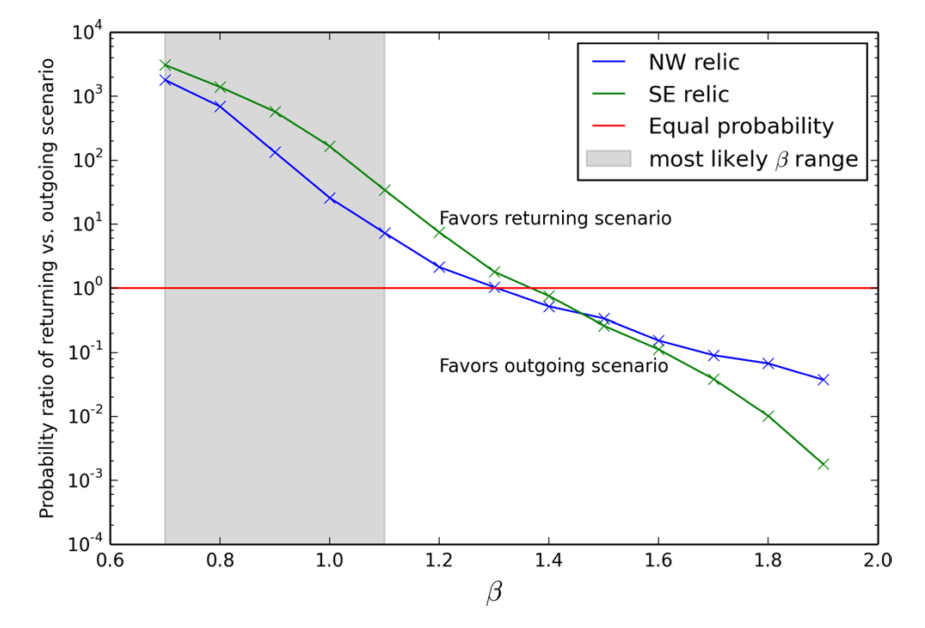
Fig. 4 Visualization of the conditional probability distribution of the
possible shockwave (relic) location vs the observed location. The observation
in red favors the returning scenario.
The published version of my paper titled 'The return of the merging galaxy cluster of El Gordo?' can be found on the journal website here.
A free version of my published paper can be found on ArXiV.
Hack session analysis from the unconference AstroHack week 2014
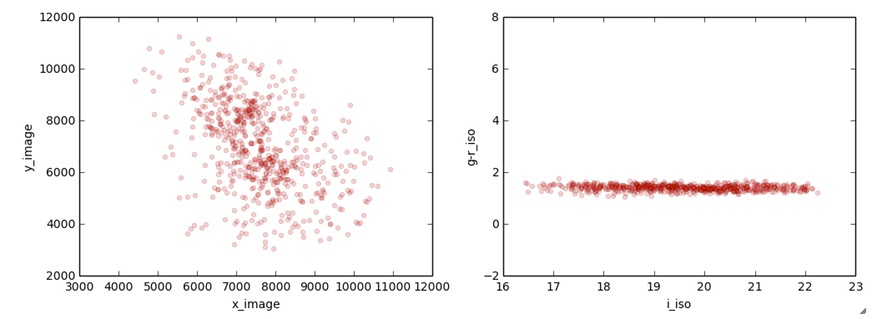
Goal: separate the signal from foreground and background using Gaussian Mixture Model
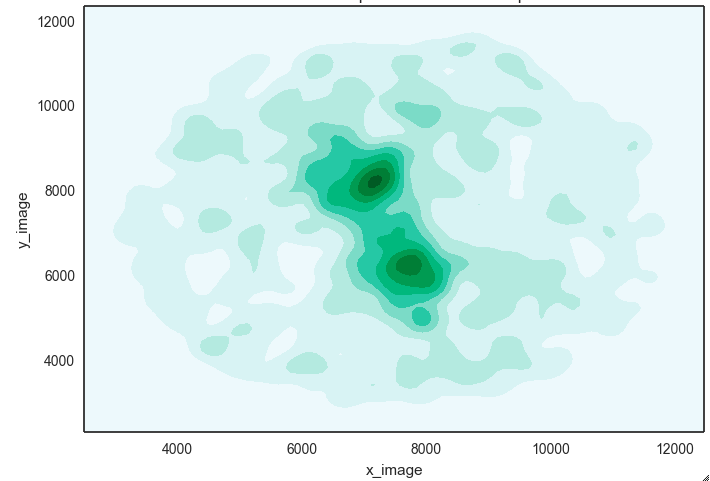
Original smoothed (discrete) galaxy data that is contaminated by
foreground and background noise.
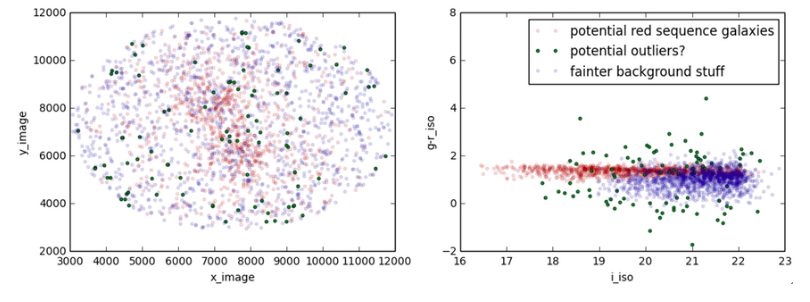
The Gaussian mixture model (GMM) that separates the data into 3
population, i.e. signal (red), background (blue) and other noise (green).
The left plot is the shape of the actual mixture, the right panel shows the
feature space that has physical meaning.
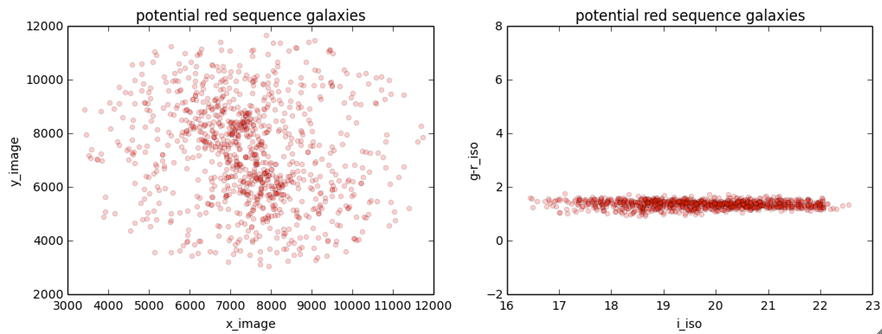
The "signal" cluster in red from the 3-component GMM model still seems
contaminated.
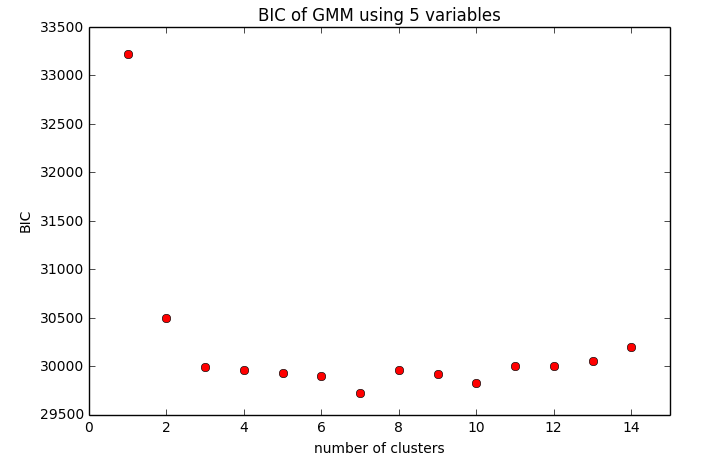
The Bayesian information criteria (BIC) uses both the likelihood and the model
complexity to measure how many components of the Gaussian Mixture Model (GMM)
would best explain the data. The lower the score, the better the model is.
The spatial distribution inferred by the 7-component Gaussian Mixture Model is
tighter and has lower false positive rate.
PhD project 2 (ongoing work)
using gaussian processes for modeling cosmic shear
Dark matter spans our universe like a cosmic web, gravitationally deflecting the paths of light from background galaxies. This work is the first to model the dark matter density with a Gaussian Process (from which gaussian random fields are drawn).
I am employed as a graduate research assistant for 6 months at the National Energy Research
Scientific Computing (NERSC), Lawrence Berkeley National Laboratory for this project.
We are actively working on innovative approaches to scale up the computation.
My first publication of this project is in preparation.
PhD project 3 (ongoing work)
characterizing galaxy-dark matter offset in galaxy clusters / groups in the Illustris simulation
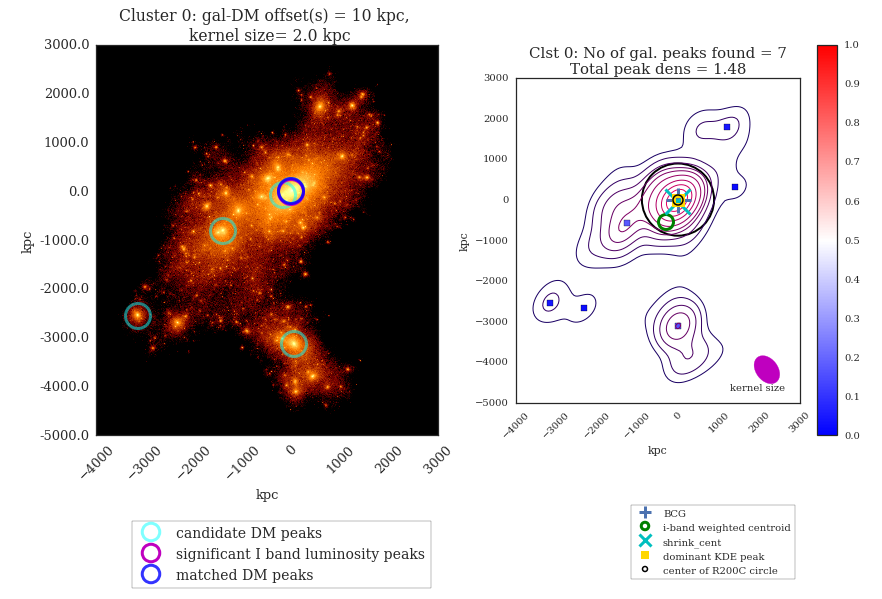
We aim to answer some urgent questions about the ability of merging
clusters for constraining the self-interaction properties of dark matter with
the data from the Illustris simulation.
Illustris simulation is one of the first cosmological simulations (think: a big box of the
universe modeled by a computer) with realistic galaxy / star formation.
Since Illustris simulation was produced without including any self-interaction of dark matter particles, it provides a excellent baseline for understanding the bias / variance of our statistical techniques for finding offsets between dark matter and the galaxies in a galaxy cluster.
To get a sense of the relative scale of the galaxy clusters that I study,
you can watch the first 15 mins of my public talk.
Or you can look at the pretty pictures of the Illustris
simulation.
Other projects that resulted in publications
1. MC^2: Galaxy Imaging and Redshift Analysis of the Merging Cluster CIZA J2242.8+5301
William A. Dawson, M. James Jee, Andra Stroe, Y. Karen Ng, Nathan Golovich,
David Wittman, David Sobral M. Bruggen, H. J. A. Rottgering, R. J. van
Weeren
ArXiv preprint
Astrophysical Journal 805 143
2. Weighing "El Gordo" With A Precision Scale: Hubble Space Telescope Weak-Lensing Analysis of the Merging Galaxy Cluster ACT-CL J0102-4915 At z=0.87
M. James Jee, John P. Hughes, Felipe Menanteau, Cristobal Sifon, Rachel
Mandelbaum, L. Felipe Barrientos, Leopoldo Infante, and Karen Y. Ng,
2014,
ApJ, 785, 20, 1309.5097, doi:10.1088/0004-637X/785/1/20